In special education, we are constantly taking data. From IEP goals to behavior goals, it can get overwhelming! Let me show you how I track data in my classroom! I’ll discuss my organization, frequency, and techniques to help keep you on track with data collection. Let’s take a look!
Data Binders
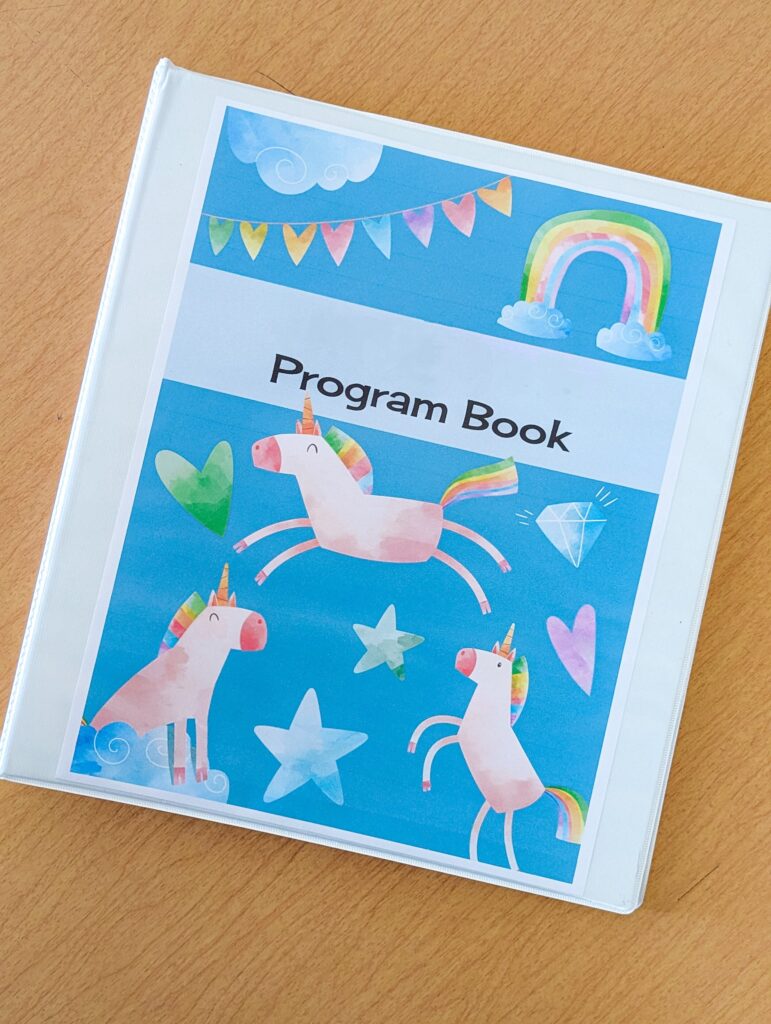
Before I start collecting any of my data, I get organized with a program book, aka data binder, for each of my students. Each of my binders include:
- Summary of mastered targets
- Tabs for each individual goal tracked
- Lesson plans or skills tracking sheet for each goal tracked
- Graphs
- IEP information (goals, objectives, SDIs, related services, etc…)
- Previous data collection sheets
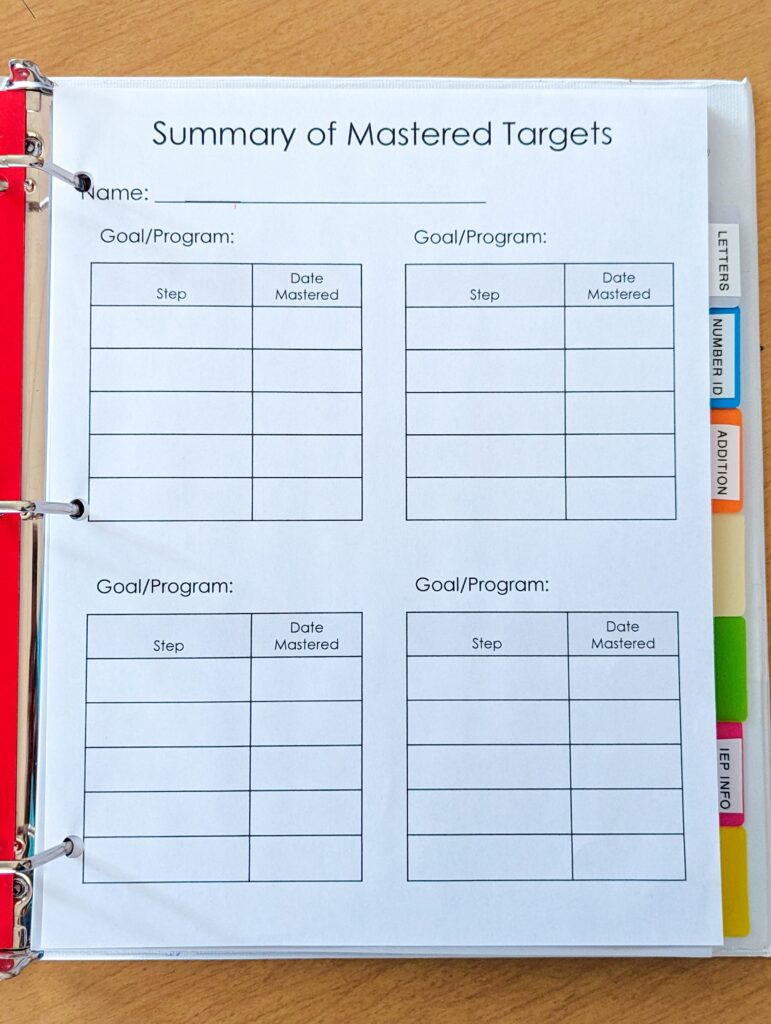
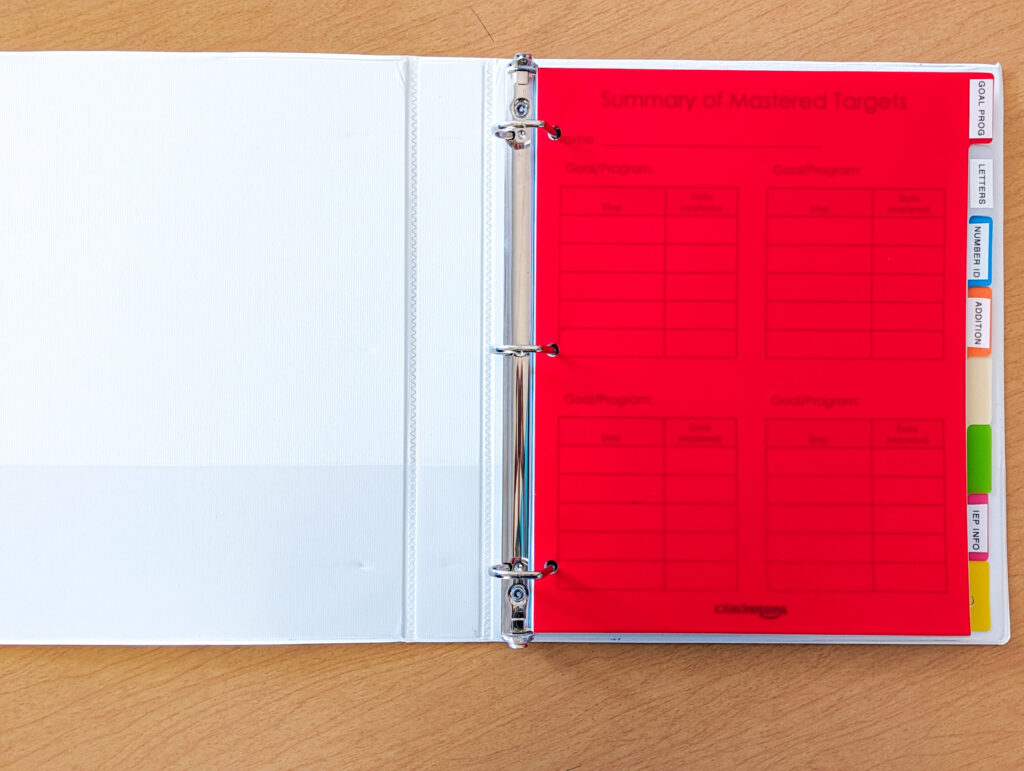
Summary of Mastered Targets
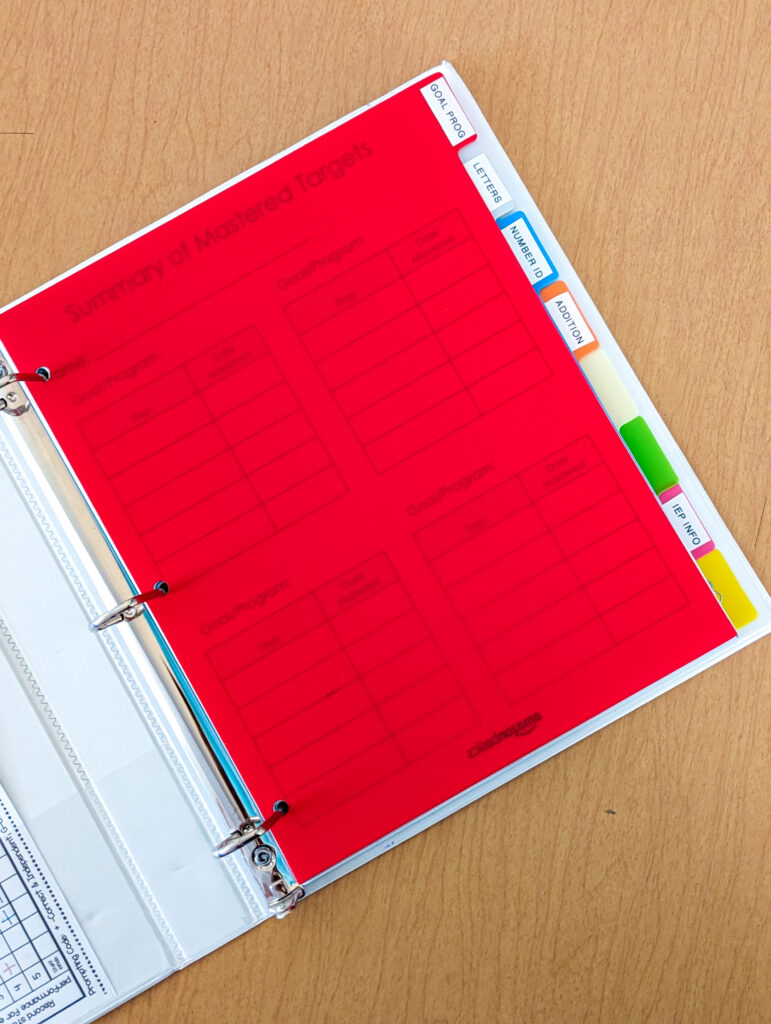
Behind the first tab of my binders, you’ll find the summary of mastered targets page. This is a quick glance at goal progress so I can make programming decisions, makes writing progress reports easier so I don’t have to flip through the whole binder to look for the information, and gives my paras an idea of what to work on with each student. I recommend using a page like this to save time and stay organized!
Tabs for Each Goal and IEP Information
To keep myself more organized, I use binder tabs to separate each goal and lesson. I also add an IEP information section at the back of the binder. The IEP information I like to include in this section is goals and objectives, SDIs (specially designed instruction), and related service information. Within each of the goal sections I include graphs and the lesson plan or skills tracking sheet associated with the goal. These give me a more in-depth look at the progress my students are making toward their goals. The final tab I include is for past data collection sheets to reference, if needed.
Lesson Plans or Skills Tracking Sheets
The lesson plan and/or skills tracking sheets are to keep track of specific steps or target items. A skills tracking sheet will show you which target skills you are tracking, the date you implemented the target, and the date that it was mastered. These are especially helpful when you are tracking discrete trial targets.
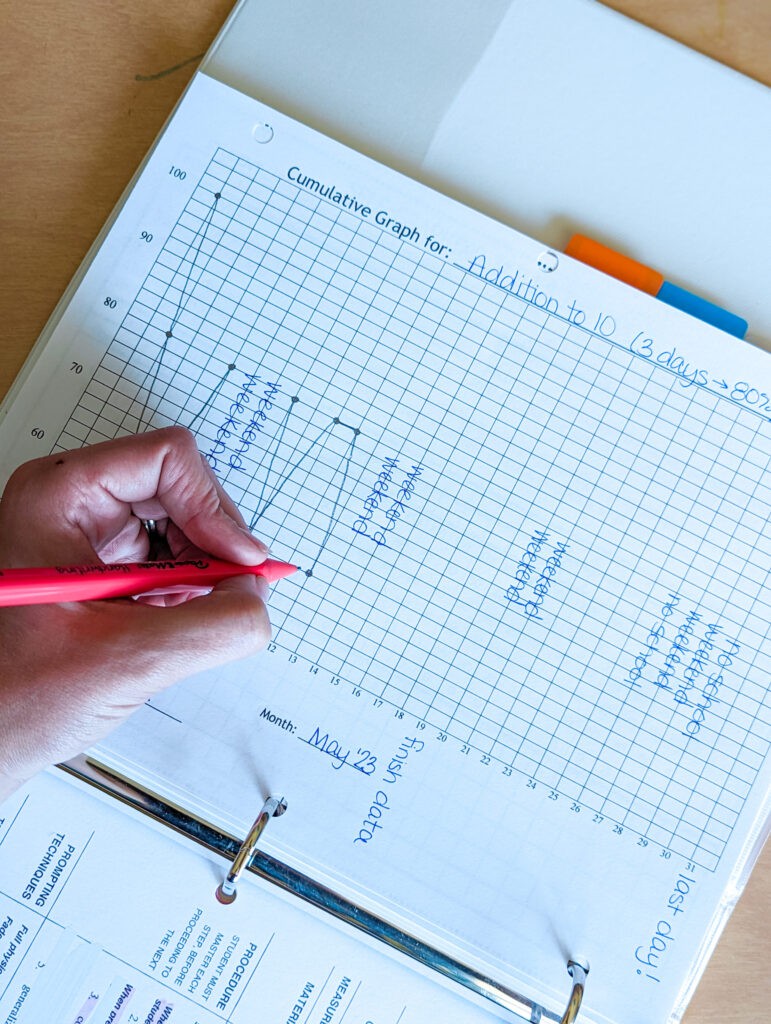
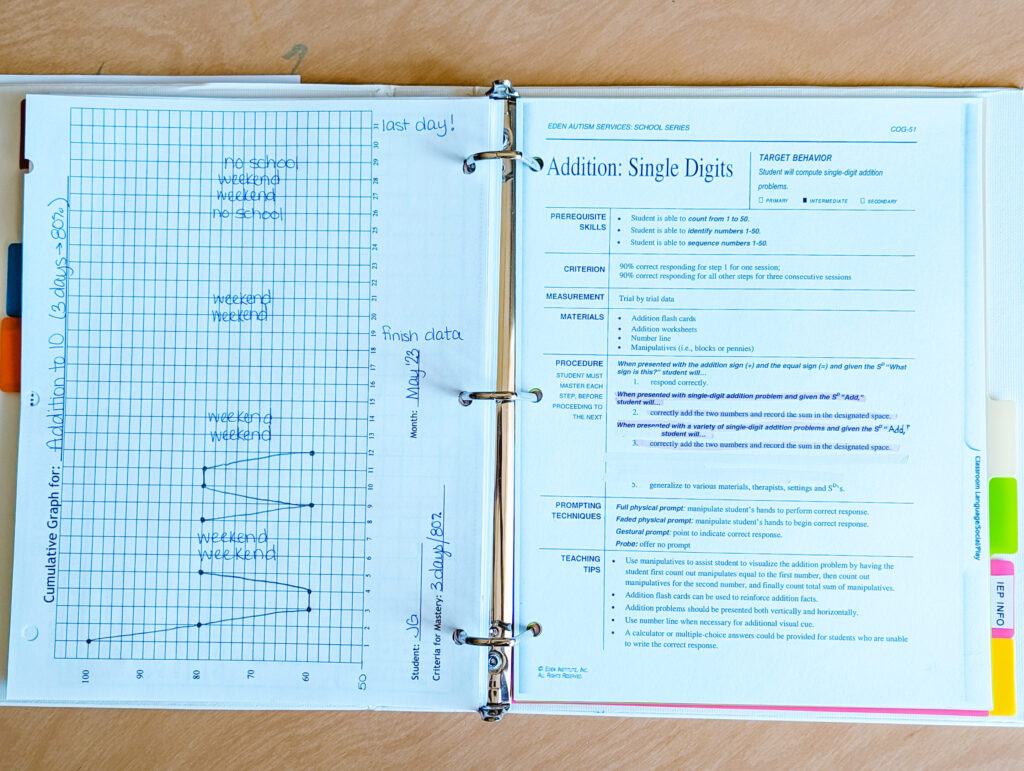
Graphs
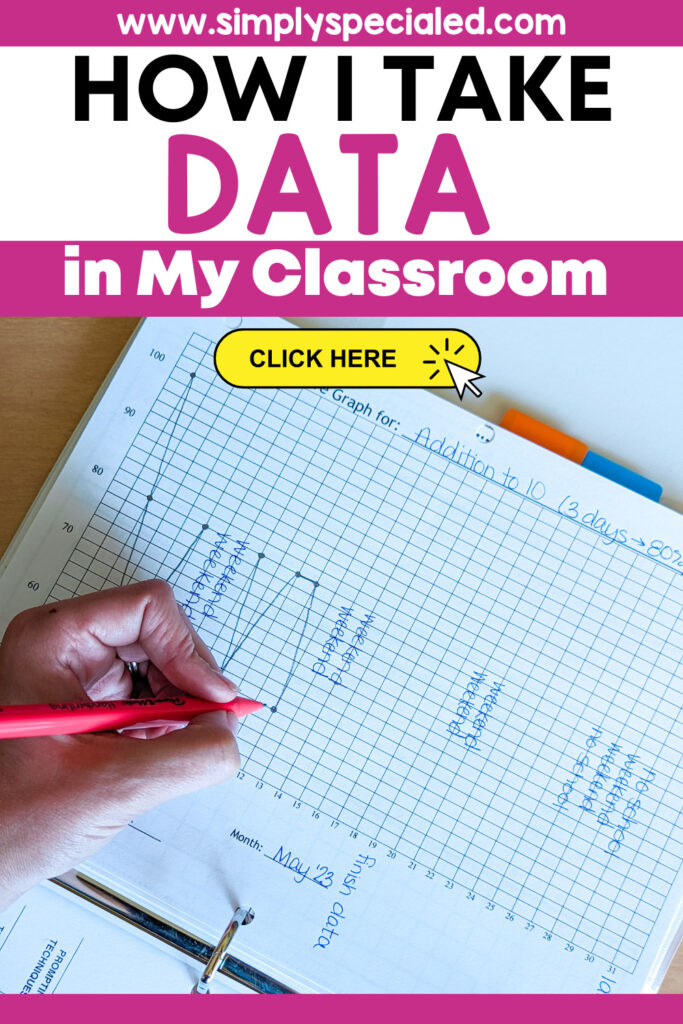
My graphs are the holy grail of pieces to my binders. I add a data point each day (or at the end of the week-depending on the goal) to keep track of goal progress. I am a visual learner, so for me, seeing the progress laid out in a graph helps me to understand the data I’ve collected and make programming decisions based on the information. You can also add the results into a graph in a program like Google Sheets or Excel to include it in progress reports or IEPs!
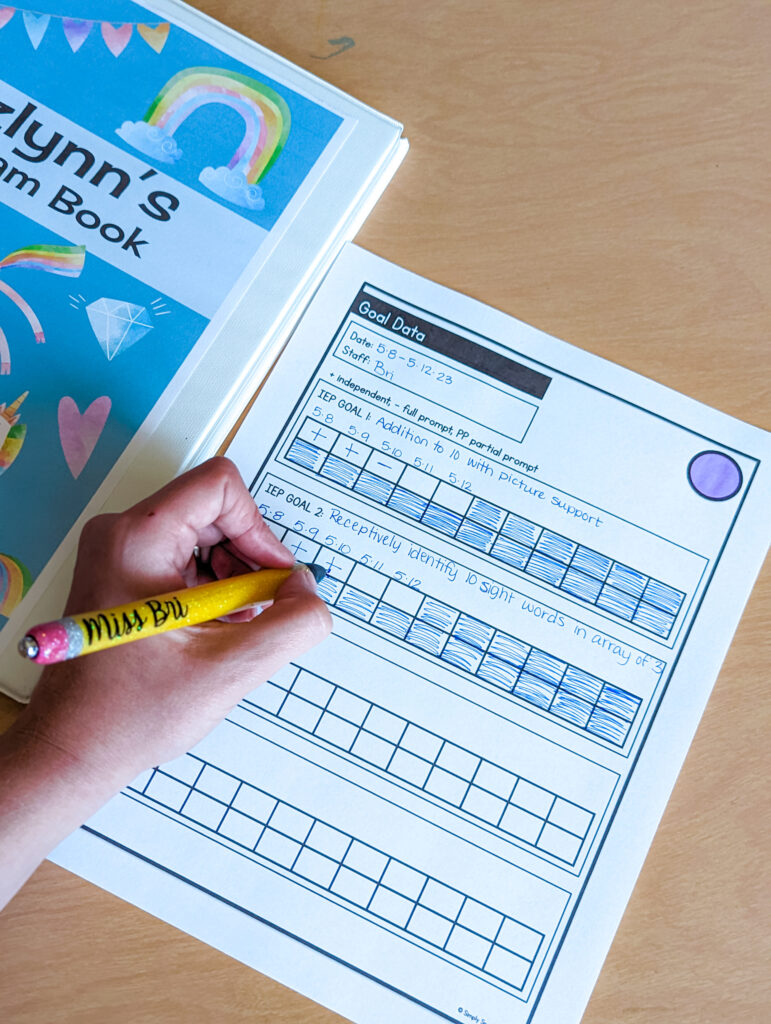
Collecting Data
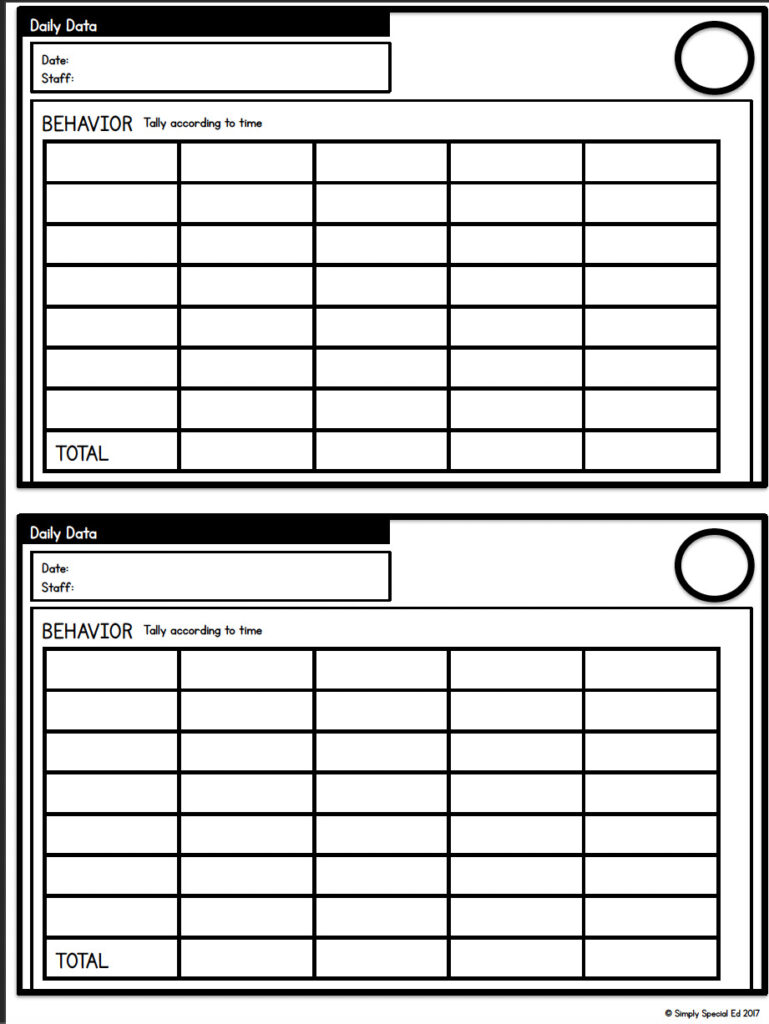
I absolutely love to use Simply Special Ed’s data sheets! They are the BEST, seriously. You’ll notice that the data sheets are simple, easy to use, organized, and easy to edit or write in the necessary information. I love using the collection sheet above because I use it for each student’s IEP goals. In the SSE data bundle, you’ll receive:
- Goal Sheets (4)
- Daily Sheets (4)
- Behavior (2 to a page)
- Toileting (full class)
- Toileting (2 to a page)
- Behavior Tally
- Behavior Data
- Community Data
- Lunch Data
- Morning Data
- Pack Up Data
- Tooth Brushing
- Hand Washing
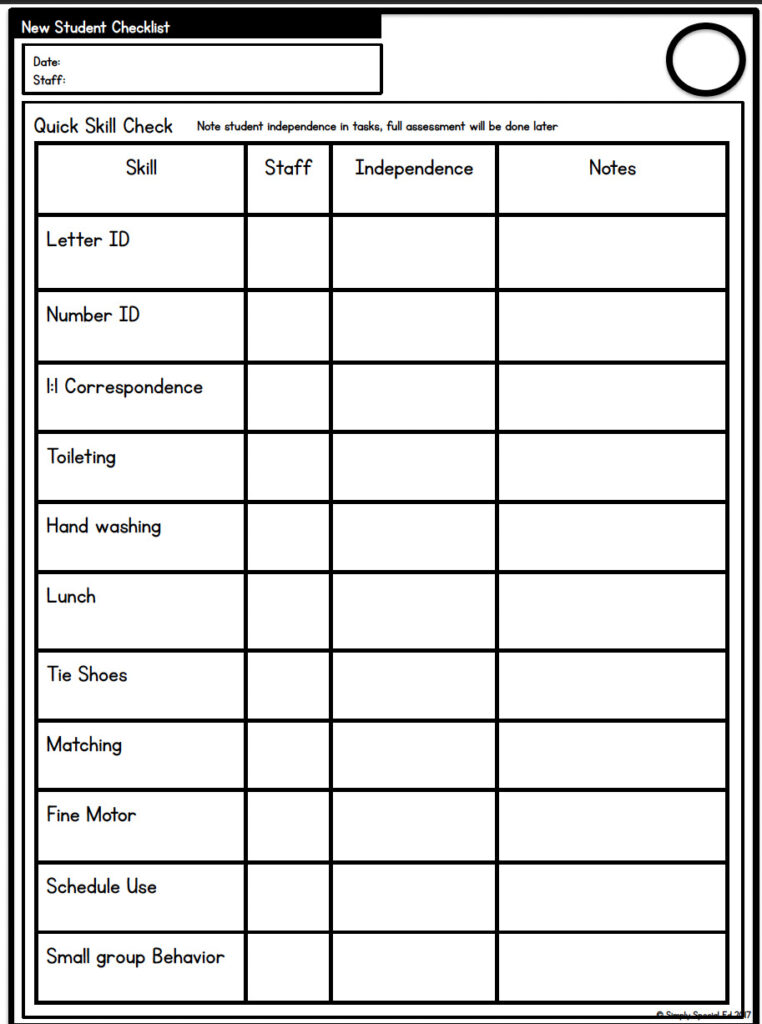
- New Student Data
- New Student Checklist
- Blank Sheets
- Editable Sheets
These are so easy to customize to your needs, so that you don’t have (what feels like) hundreds of collection sheets lying around your classroom. Since they’re so uniform, your paras will be able to use these easily as well! Here are a few of my favorites to use in my classroom:

Read more about how to use these data sheets here!
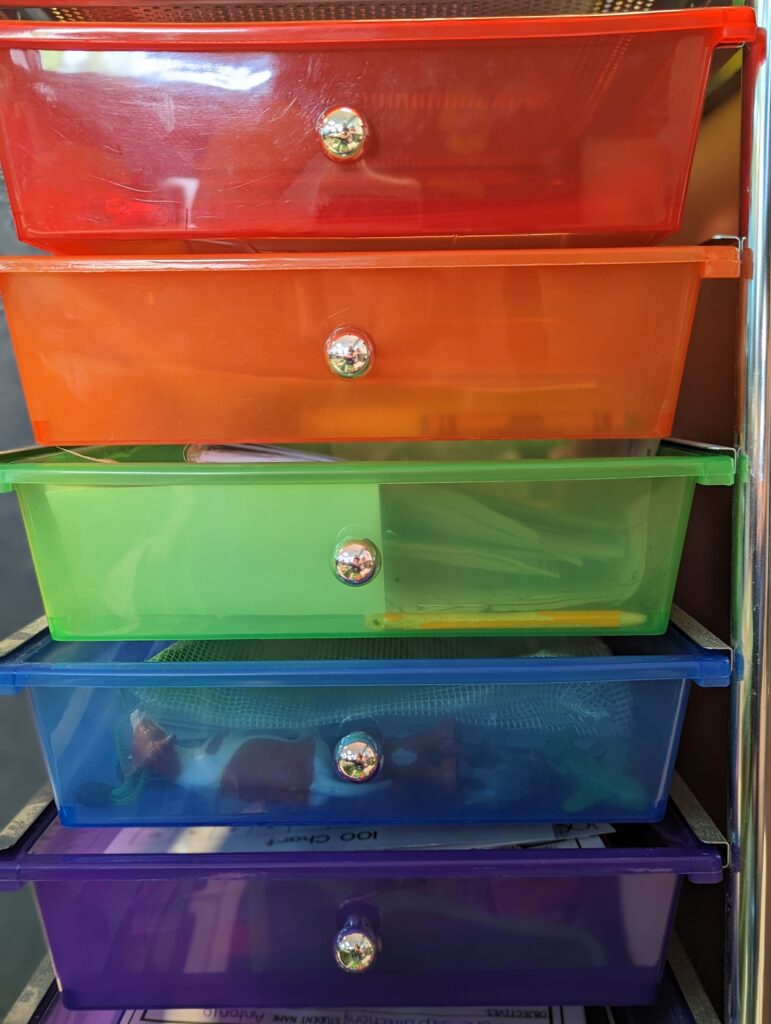
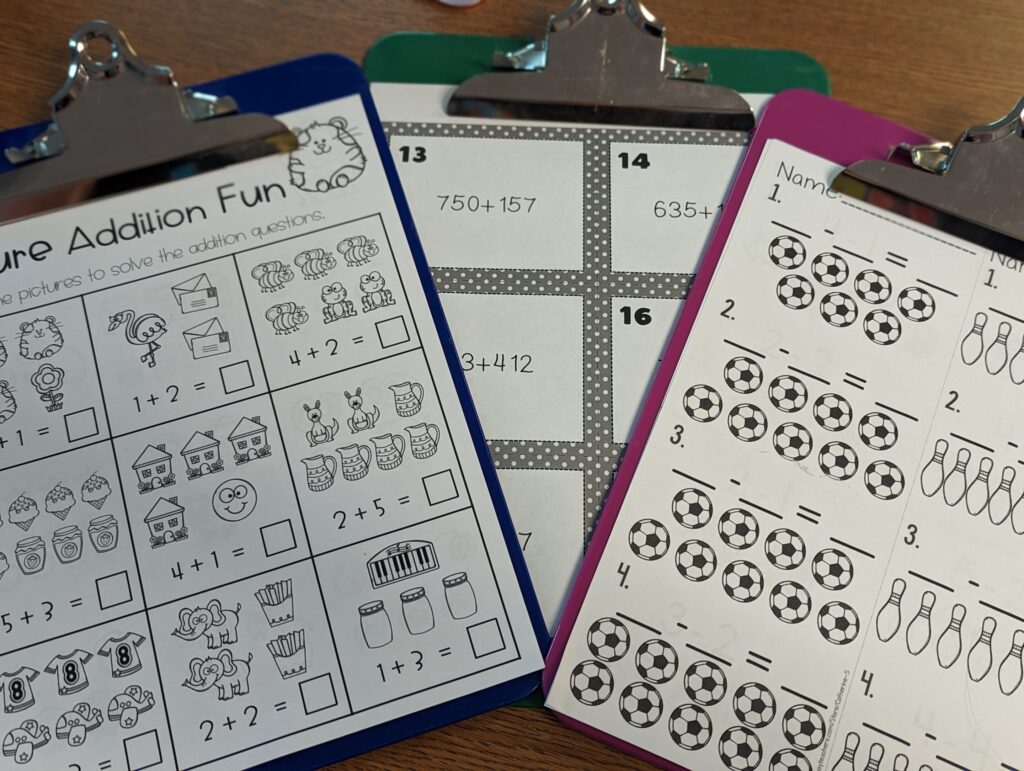
Color Coding for Data
The number one way I am able to stay organized aside from my program binders is by color coding my students. I use this 10-drawer cart (affiliate link) to organize IEP goal items by color, which tells me which student it belongs to. Since my students typically stay in my class year after year, I keep them the same color each year so I don’t get confused. This year I might buy the clear cart since I will have more than 5 students in my class, and use colored labels on each drawer. I also use color coded clipboards for easy data collection (used here for academics, but heavily used for traveling behavior data). Do you color code your students?
If you’d like to learn more about how to collect and analyze data, check out these resources:
The Special Educator’s Guide to Data Collection
Why You Should Color Code Your Data Sheets
Print and Digital Data Sheets Bundle