Data is the name of the game in special ed. You have all your data, but now what? Analyze it! Let me walk you through how to analyze your data to increase student progress!
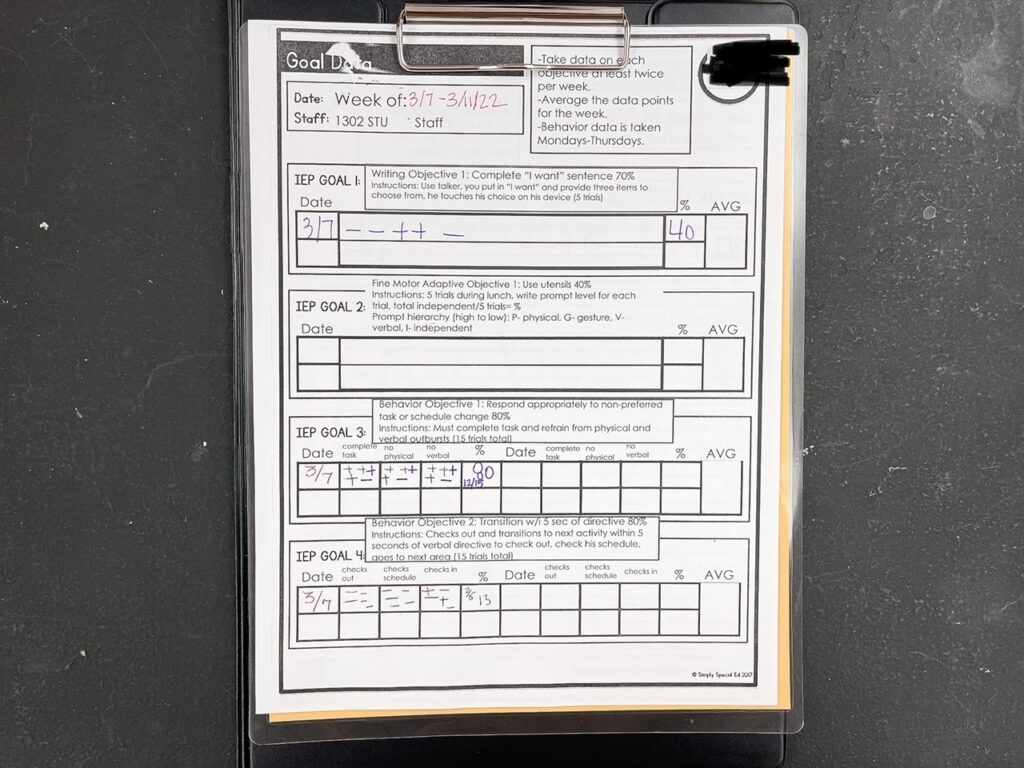
Prepare Your Data Sheets
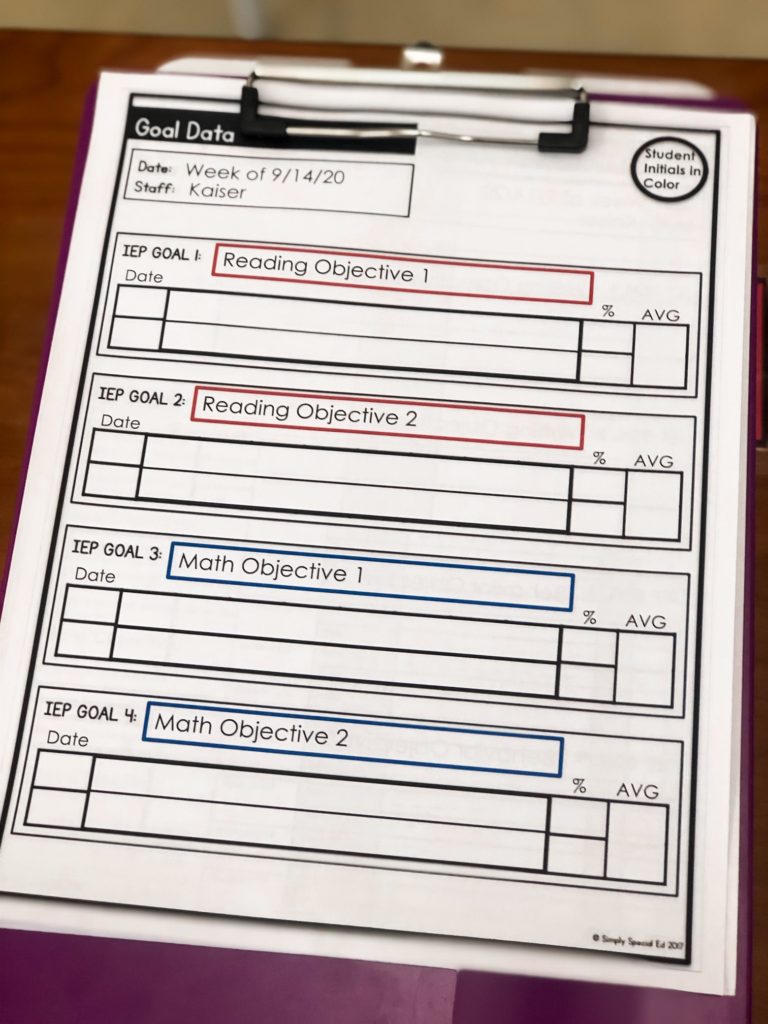
To get started with your data collection, you need to prepare your data sheets. I use the Simple Data Sheets. These data sheets are totally editable, plus they come in print and digital versions. I have started trying some of the digital versions, but I still mainly use the print version. I love that you can edit the data sheets in Google Slides to fit exactly the needs of each student’s IEP goals.
Free Training
This 25-minute free webinar walks you through how to set up your own IEP Goal Bin system—plus you’ll get free templates to start today.
You don’t need more pressure. You need a system that works. And this is it.
Take the Data
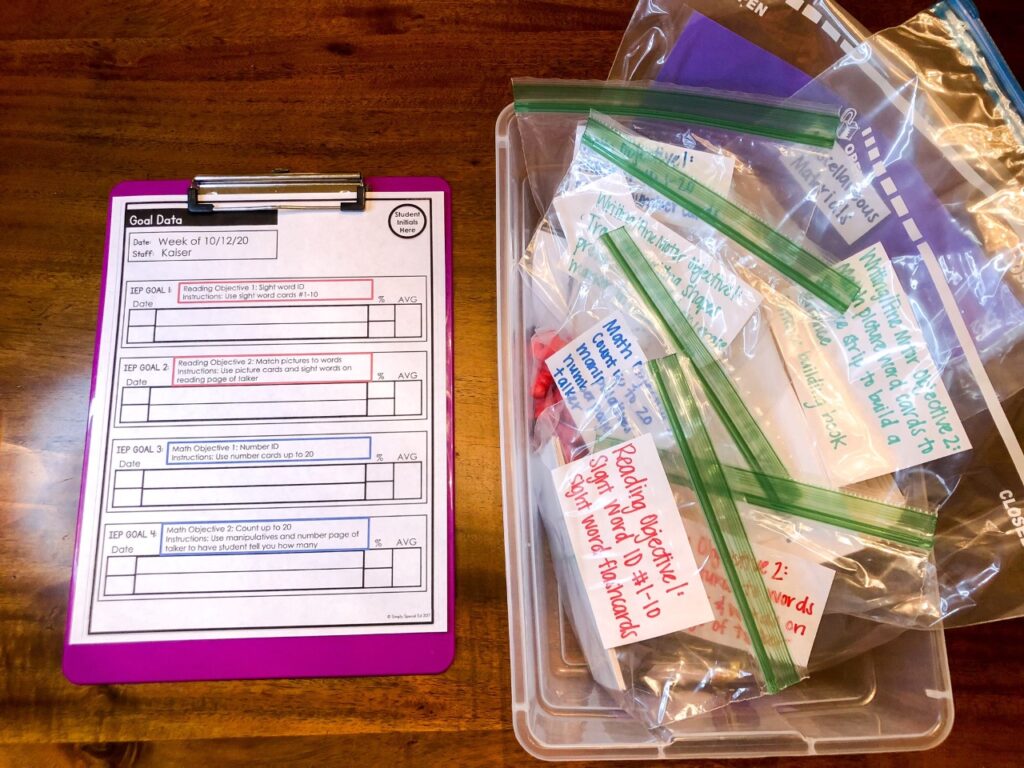
You have your data sheets ready, now it is time to take the data! I use IEP goal bins in my self-contained classroom. These bins hold all materials to take data on a student’s goals and objectives. Read my blog post for a tutorial on how to setup IEP goal bins. Decide on how you will take data each day, whether it be 1:1 or groups.
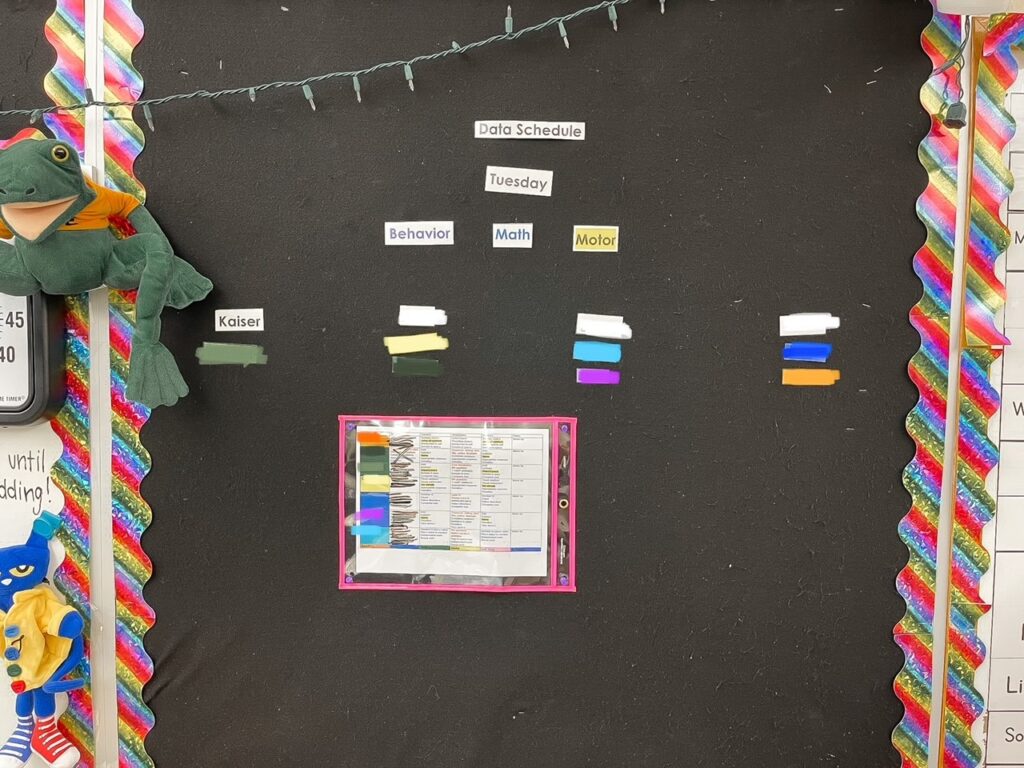
Also, decide on your progress monitoring schedule to ensure you collect all necessary data each week. For tips on using a progress monitoring, check out my blog post.
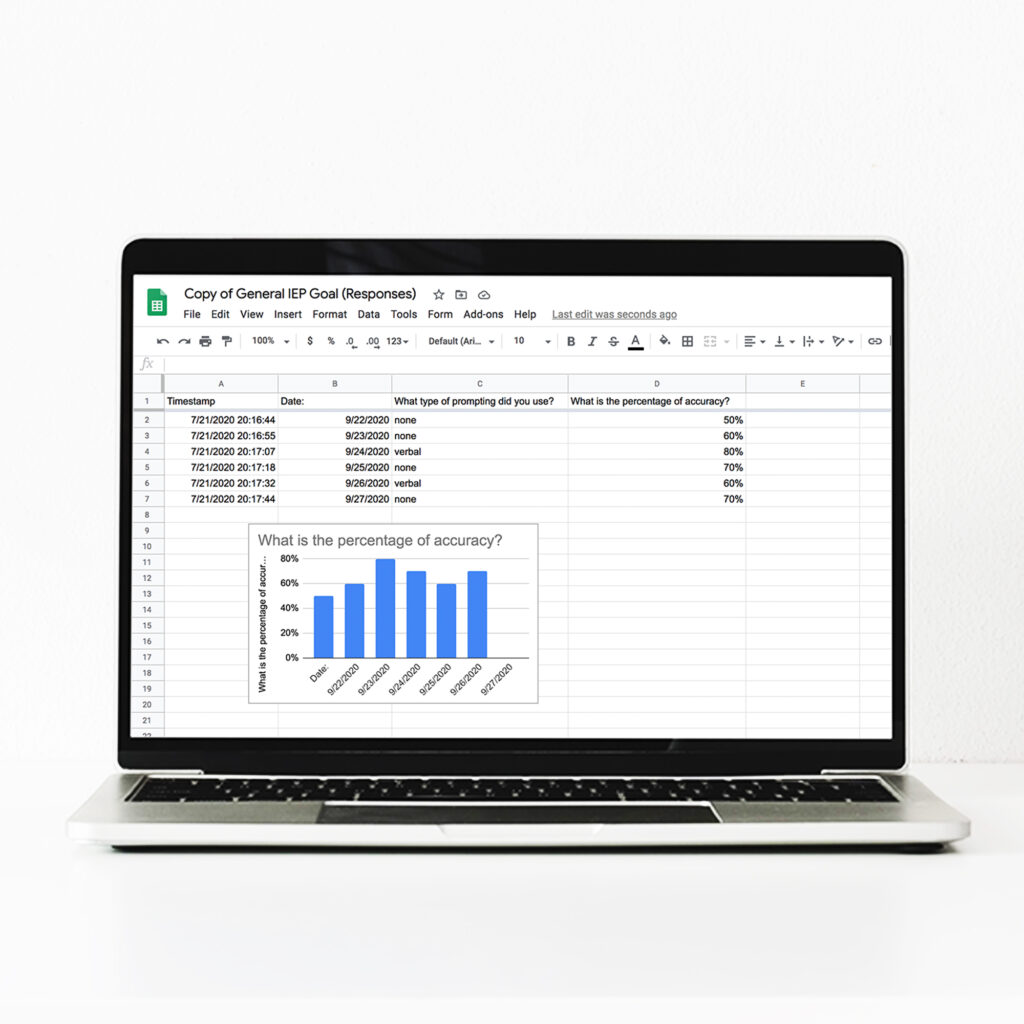
Graph Student Data
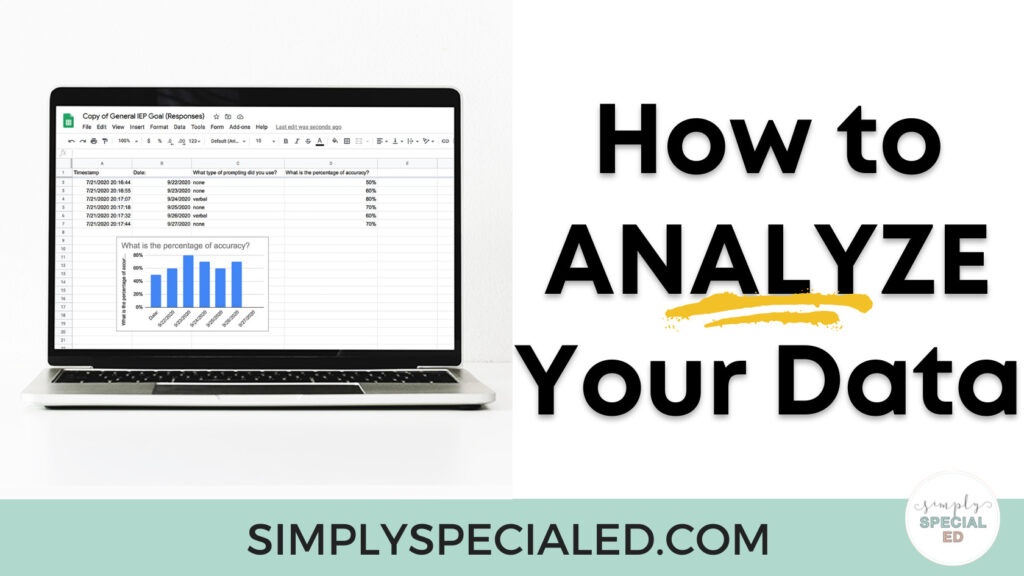
The data has been taken, now let’s get to analyzing. Input your data into a graphing program. My district uses Infinite Campus, but you can also use Google Forms to graph data. In the Special Education Data Sheets Bundle, there are video tutorials included on how to use Google Forms to collect data, make graphs, and more! Going digital isn’t always easy, so the video tutorials are a life saver!
Analyze the Data
Now that you have your data graphed, we can analyze it! Make sure to use a program that shows you some kind of trend line. Look at each goal’s trend line to determine if progress is being made or not. If you see that the data is trending down or plateaued, then consider making adjustments to your instruction. My team at my school meets each month to analyze data together and give each other ideas if we have students not making progress. This is great to get help if you’re stuck on how to help a student start making progress again.
Analyzing your data doesn’t have to be complicated! Make it simple! Use the Special Education Data Sheets to make the entire data analysis process a breeze! So tell me, do you prefer print or digital data collection? Share your thoughts in the comments!
Grab the Data Sheets Bundle here.
Try a free ABC data sheet here.


")
